|
|
| CLIMATIC AND AIR HYGIENE MAPS AS AIDS FOR PLANNING AND ZONING (EXAMPLE: CLIMATE ATLAS FEDERATION REGION STUTTGART) |  |
| | | |
 5.3 Meteorological Base Maps 5.3 Meteorological Base Maps |
Over the course of one year a temporary measurement network (12 stations at various altitudes and in areas with various land uses) was installed by the German Weather Service in the territory of the Stuttgart Regional Federation, with the goal of recording the temperature, humidity, and wind conditions in the study area. Surface-covering maps for the climatic elements (annual average air temperature, average daily minimum and maximum air temperature, number of days with equivalent temperature > 49°C, annual average wind velocity, and frequency of low wind) were developed from the measured data with the help of a statistical process based upon altitude and land use and derived parameters such as days with heat stress.
Figure 5/4 shows the distribution of the average annual air temperature, and Figure 5/4a the middle annual maximum. One recognizes clearly, the differences in the temperature, resulting in from the altitude of the area, in addition, the warmer more closely cultivated areas.
From the distribution of the mean daily minimum air temperature Figure 5/4b shows that high-altitude areas are characterized by low minimum temperatures. Lower-altitude areas exhibit generally higher minimum temperatures and are marked in violet. In the lower-lying areas, narrow and relatively strongly-cut valleys and depressions are also noticeable in blue color tones, since the pooling of cold air there leads to lower minimum temperatures.
In the Figure 5/5 the middle annual wind velocity is represented. Altogether the region is wind-weakly with middle annual wind velocities partially under 1 m/s in the cultivated structures. Only in the altitudes in the south somewhat higher wind velocities arise.
One of the wind measurements derived and important for urban planning is the size of ventilation (Figure 5/5a).
|
|
| | | |
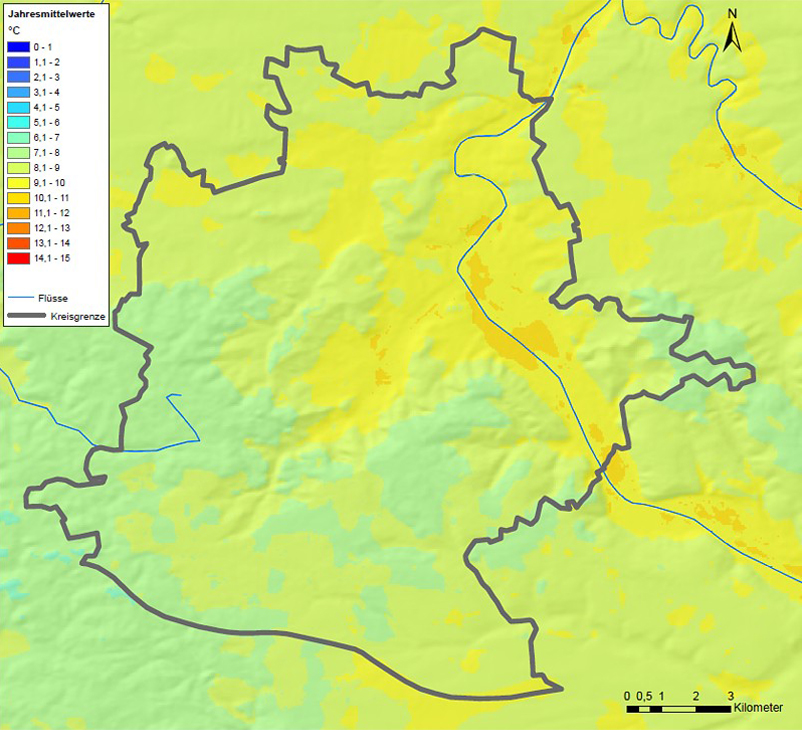 |
| Fig. 5/4: Average annual temperatures, Stuttgart city area, Data Source: Climate Atlas Region Stuttgart (2008) | | |
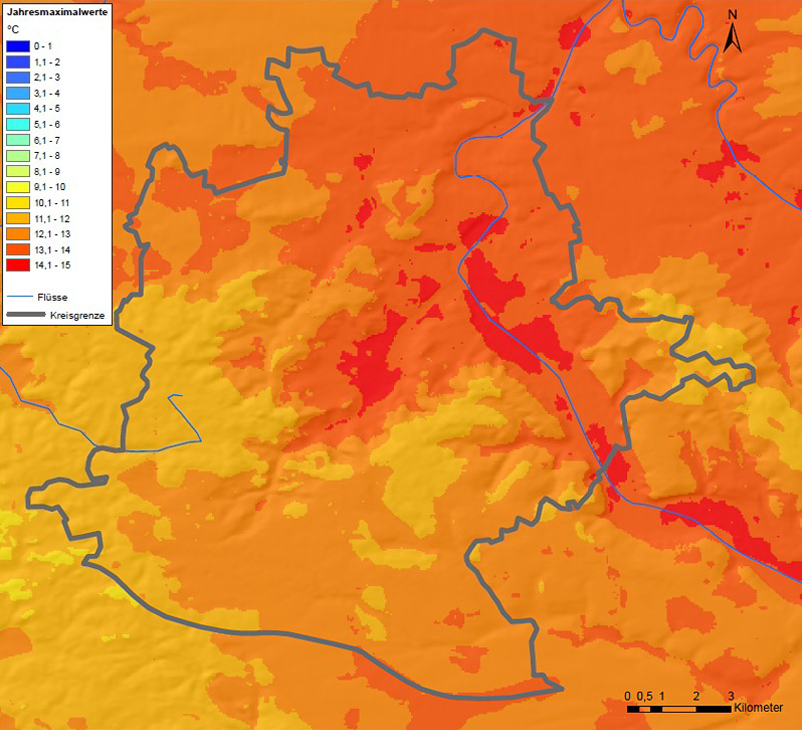 |
| Fig. 5/4a: Average annual maximum temperatures, Stuttgart city area, Data Source: Climate Atlas Region Stuttgart (2008) | | |
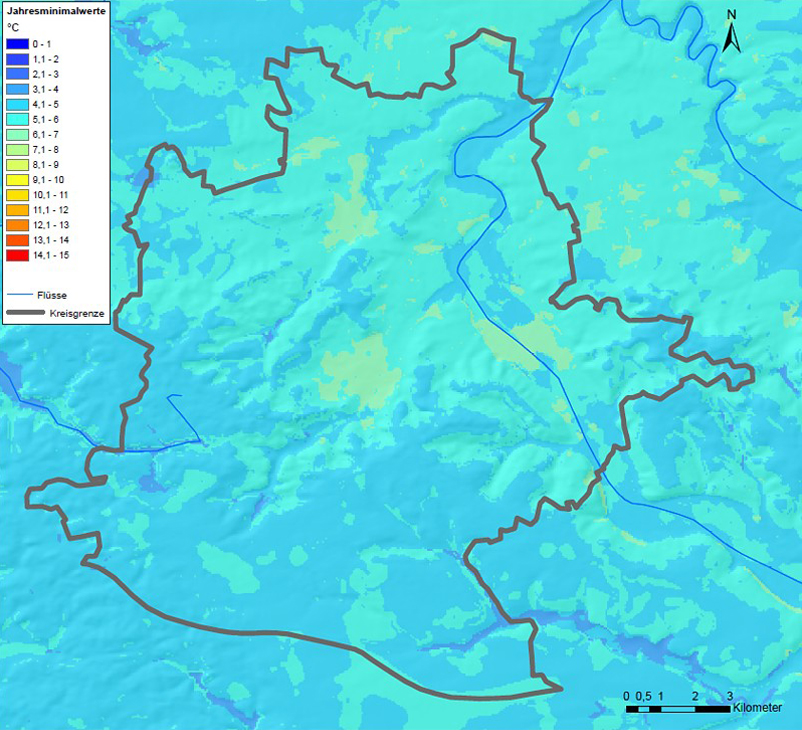 |
| Fig. 5/4b: Average annual minimum temperatures, Stuttgart city area, Data Source: Climate Atlas Region Stuttgart (2008) | | |
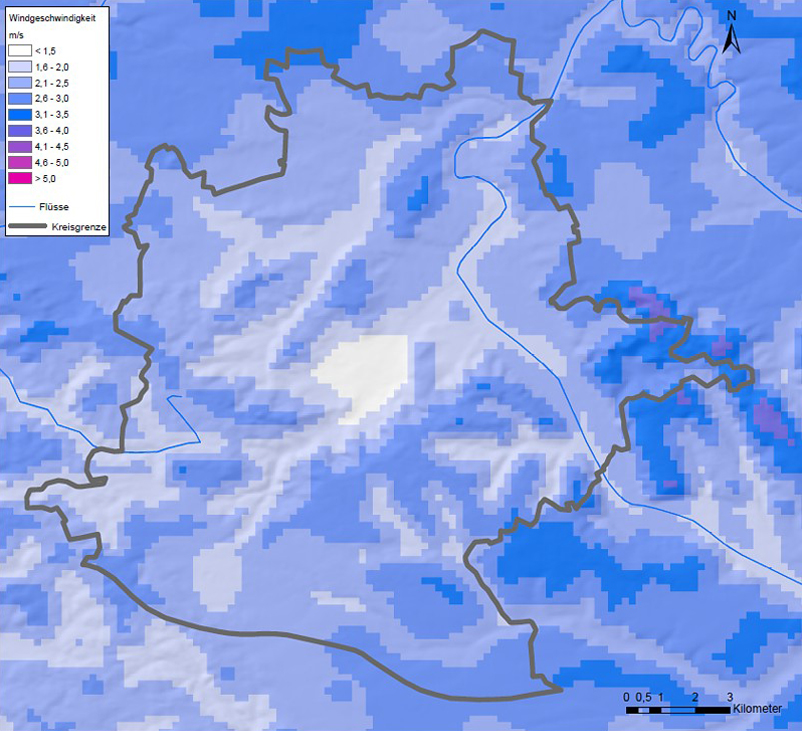 |
| Fig. 5/5: Average annual wind velocity, Stuttgart city area, Data Source: Climate Atlas Region Stuttgart (2008) | | |
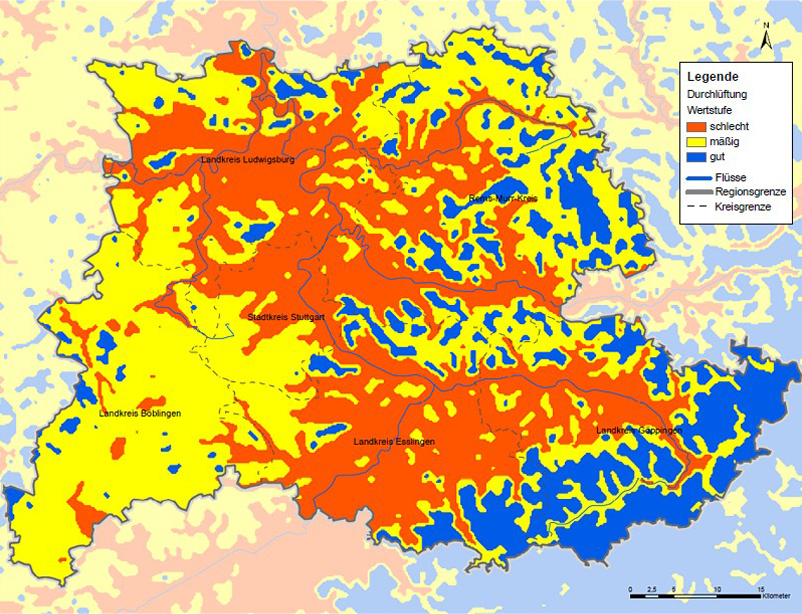 |
Fig. 5/5a: Ventilation situation in the Stuttgart Region, Source: Climate Atlas Region Stuttgart (2008)
.
|
|