|
|
| METHODS OF INFORMATION ACQUISITION FOR PLANNING
(MEASUREMENTS, WIND TUNNELS, NUMERICAL MODELLING) |  |
| | | |
 4.2.2.2 Wind Velocity Measurements 4.2.2.2 Wind Velocity Measurements |
Changes in the wind field, such as those that can be caused by buildings, can be studied in simple form through sand erosion measurements. In these, the physical model is sprinkled with sand and the erosion is registered under various strengths of wind velocity blown at the model. From this, data are collected about the areas in the vicinity of a building where the wind velocity decreases or increases (Figure. 4/11).
For an exact determination of flow velocities and their rapid temporal changes, hot-wire or laser Doppler anemometers (LDA) are used for example. As hot-wire anemometers are rather small in size, they can be easily placed in a model (Fig. 4/12, left side). Laser Doppler anemometers allow for a non-contact operation (Fig. 4/12, right side). Both systems are characterised by short reaction times, which qualifies them for generating speed time series in the wind tunnel.
|
|
| | | |
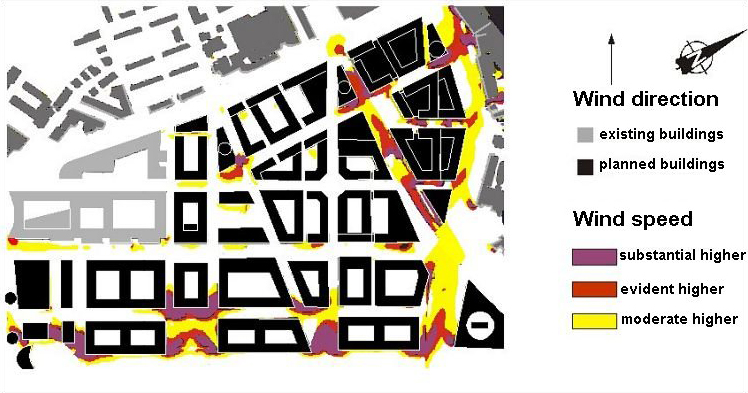 |
Fig. 4/11: Visualization increased wind speeds by sand erosion studies,
Source: BLAZEK et al , 1998 | | |
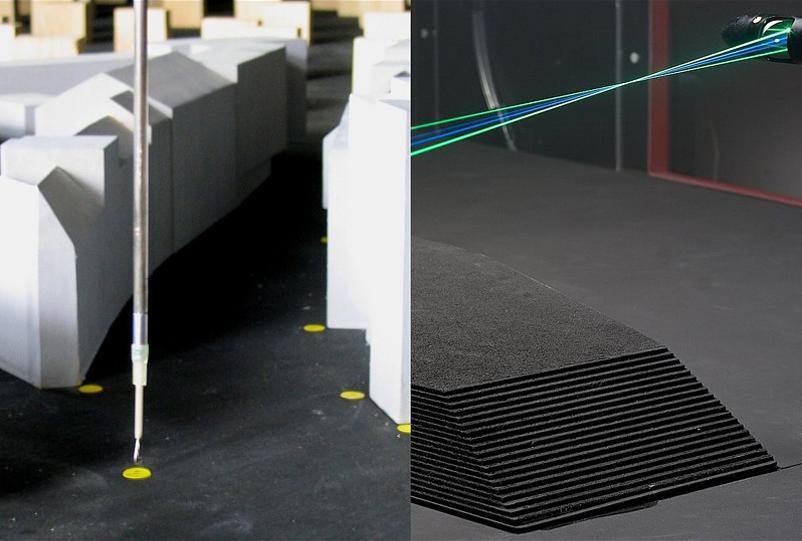 |
Fig. 4/12: left : hot wire anemometer in street canyon , Source: Engineering Office Theurer
right : laser Doppler anemometer Source: University of Hamburg , Institute Meteorological |
|