|
|
| ENERGY-CONSCIOUS PLANNING AND ZONING |  |
| | | |
 3.3.2 Local Climate Criteria 3.3.2 Local Climate Criteria |
This section deals with the local influences that often cause substantial deviations in a small area from the temperature values typical for the climatic region, with the consequence of unusual energy usage.
Heat Island Effect from Development
Figure 2/2 depicts the factors contributing to the urban heat budget, whose collaborative effect allows heat islands to form in built-up areas. This heat island effect is quantified in Figure 2/4. As mentioned previously, these findings are connected with a substantial reduction in heating energy usage, which can be estimated at 10% to 15% for a large city. This topic of concern is one of the few advantages that urban development and its associated soil capping can offer from a climatic perspective.
Decline in Temperature with Height
The laws of physics imply that average air temperature declines with increasing altitude of a location. On a yearly average this height-dependent temperature decrease amounts to 0.5░C for each 100 m. In summer and spring this amount increases to approximately 0.6░C for each 100 m, while it reduces to 0.4░C in fall and 0.3░C in winter. Figure 3/20 depicts graphically the relationship between average temperature values and altitude for the various times of year. It can thus be assumed that locations at higher altitudes above sea level exhibit heightened heating energy needs due to lower outdoor temperatures. This fact, while accurate in principle, can be obscured by topographical microclimatic effects.
Cold-Air Collection Areas and Blockage Areas
Land forms such as hollows, depressions, and valleys function as cold-air collection areas during the night. The cold air that flows together into these areas from the surrounding slopes and heights on windless, cloudless nights produces lower nightly minimum temperatures, which are in turn compensated for during the days ¢ especially in summer ¢ by the statistically higher average temperatures typical for valleys. Extremely low nightly minimum temperatures result when cold air flowing into a collection area encounters impediments that result in a stagnant lake of cold air, also known as a blockage area. These are also those areas in danger of early and late frosts, in which frost-sensitive flora and fauna are impossible to maintain or are at least frequently damaged (see Chapter 6.2.4 and Fig. 6/27).
In the interests of energy-conscious planning, cold-air collection areas and cold-air blockage areas in particular are to be avoided as potential areas for development. The climatic disadvantages related to these areas can result in an increased heating energy usage of up to 20%.
Frequency of Mist and Fog
Areas with high frequencies of mist and fog are characterized in equal parts by a lowered temperature level and reduced sunlight during the low-exchange heating period. Usually these areas are the above-mentioned cold-air collection areas and blockage areas in valleys and hollows, but they also occur out on flat, open landscapes near bodies of water and humid areas. The high frequency of ground inversions in temperature highlights the air exchange deficiencies present in these areas, as explained in Figure 3/21 and 3/22.
Although air temperature normally decreases by about 1░C for every 100 m of altitude in the open atmosphere, an increase in temperature with altitude occurs in the presence of a temperature inversion, e.g. because of warm air flowing upward into the atmosphere. Inversions indicate a barrier for vertical air exchange and thus favor the appearance of mist and fog, especially when they lie directly on the ground surface, called a "ground inversion." The reasons for the presence of a ground-hugging layer of cold air lie mostly in the exchange deficiency and strong nightly cooling of the earth"s surface. Areas at risk of ground inversions are poorly suited for development on the basis of their unfavorable thermal conditions and the increased heating energy requirements to be expected.
Recommendations
For energy-related reasons, southeast- through southwest-oriented locations at moderate altitudes ¢ with their correspondingly favorable temperatures ¢ are best suited for development in any situation. These locations can be protected against cold air flows coming from the higher elevations by wooded mountaintops, slopes, and ridges.
To avoid thermally unfavorable situations in location planning, the first recommendation is a basic evaluation of the topographical situation. The type of previous agricultural land use can also give signs of thermally unfavorable conditions. The German Weather Service has produced various climatic maps for Baden-W³rttemberg; their disadvantage, however, is that they are often at too large of a scale for location planning (JENDRITZKI et al., 1990), such that detailed assessments in the form of specialized studies are often necessary.
In this context the infrared thermograph presented in Chapter 5.2 proves to be especially valuable. The climate analysis maps described in Chapter 5.7 take into consideration questions of heating energy by mapping cold-air collection areas and blockage areas. Areas at risk from ground inversions as well as areas with higher frequencies of fog and mist are also identified in these types of maps. Also Bioclimate data, such as in the regional Climate Atlas ( STUTTGART REGION ASSOCIATION, 2008) are valuable documents.
|
|
| | | |
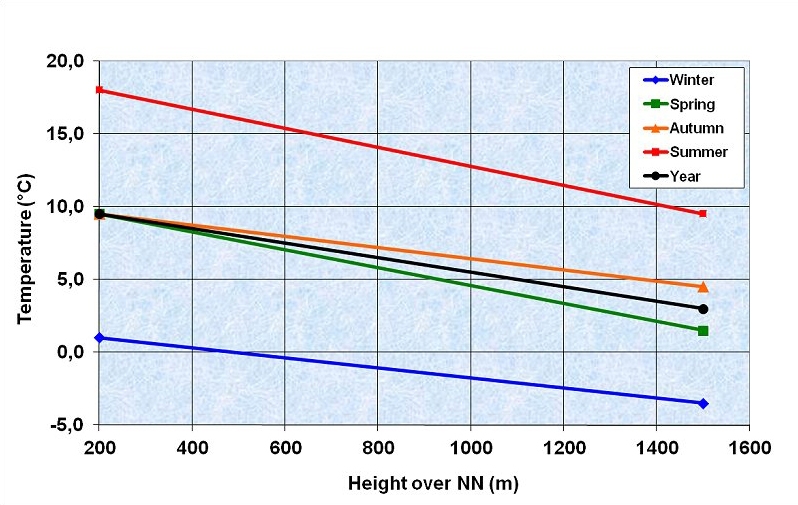 |
Fig. 3/20: Average annual temperatures for locations at various altitudes Source: German Weather Service, DWD
| | |
 |
| Fig. 3/21: Examples for the vertical temperature gradient in the free atmosphere; vertical temperature profile with ground inversion | | |
 |
| Fig. 3/22: Examples for the vertical temperature gradient in the free atmosphere; vertical temperature profile with an inversion at altitude | | |
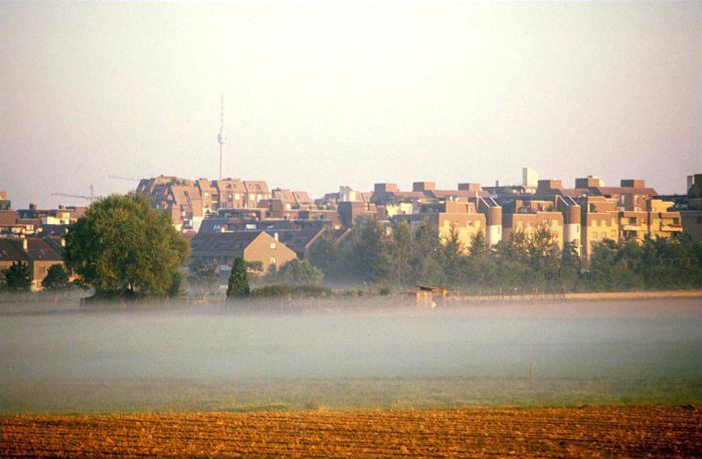 |
| Fig. 3/23: Cold air pool, visible via fog formation (ground inversion) | | |
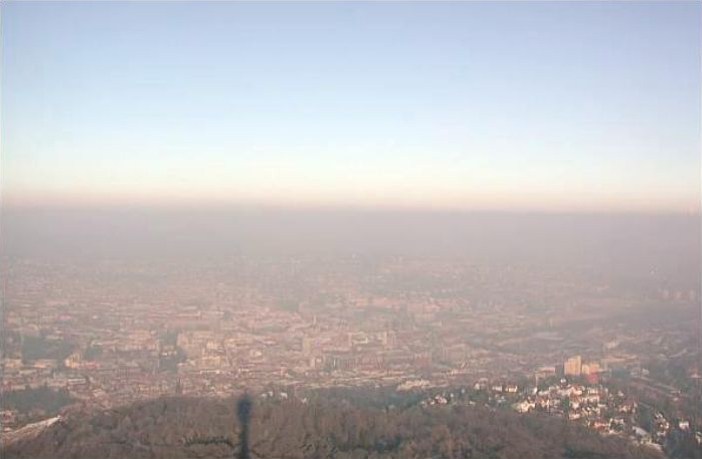 |
| Fig. 3/23a: Inversion at altitude over Stuttgart valley |
|