|
|
| ENERGY-CONSCIOUS PLANNING AND ZONING |  |
| | | |
 3.2.3 Aids for the Study of Sunlight Conditions 3.2.3 Aids for the Study of Sunlight Conditions |
Horizontoscope
A simple but very useful aid for the preparation of images showing buildings at an existing location is the "Horizontoscope" (Figure 3/14) developed by TONNE and produced by the Institute for Daylight Technology in Stuttgart (www.ift-stuttgart.de), this is no longer available, but because of its clarity helpful. The Horizontoscope consists of a Plexiglas half-sphere with a level, equally transparent bottom, which can be placed on a diagrammatic disk as shown in Figure 3/12. At the location to be examined, the device is held horizontally by means of an integrated compass. When viewed from above, the reflective half-sphere then shows the building picture in polar projection. In this way the building picture is reflected on the underlying diagram, allowing an immediate evaluation of the sunlight conditions.
Computer Simulation Programs
These shading diagrams can of course also be produced with appropriate programs when digital plans are available. The computing model SHADOW has been developed specially for the assessment of shortwave radiation (sunlight) in a model area. It can be used both for studies in urban areas and for issues of land climatology or agrarian meteorology, as the program takes into consideration the topography of the land in addition to the arrangement of shading objects. For example, with RayMan ( Matzarakis et al. , 2010) in addition to answering various urban climate issues also Horizontogramme or shadows are calculated and displayed (see Figure 3/15 and 3/16).
More intricate aids are necessary for the assessment of sunlight conditions in complex built-up areas. For this purpose, GORETZKI (1990, 2012) developed a computer model (GOSOL) as a basis for energy simulations, which makes possible the assessment of the solar-energy characteristics of a planning concept as well as its spatial depiction.
The basis is a three-dimensional computer model including buildings, vegetation with seasonal foliage and topographic conditions.
One of GOSOL"s characteristic features, which shall be expressed by the description "solar+energetic", is the creation of complete energy balances for every single building or in the form of sum and average values for the whole development plan area. Thermal heat balances contain the building"s specific heat losses (depending on the heat insulation standard, the heating system and the building geometry) as well as interacting passive and thermal solar gains at a particular orientation or shadowing of the building. Faulty optimisations can be avoided by balancing the opposing thermal gains and losses in the variable "heating or primary energy requirement depending on the living space". It is also possible to determine the photovoltaic potential of solar energy and thus a total energy balance of the planning area.
Furthermore, the reasons for reduced solar gains or increased heating requirements are determined for every building within the area under investigation, and this itemised in the categories:
unfavourable orientation of the building
shadowing from neighbouring buildings
shadowing from vegetation
shadowing from orographic features.
These categories help to define good starting points for a promising optimisation of the solar energetic planning.
For an evaluation of the quality of living conditions under the aspect of sufficient insolation, it is also possible to represent the possible sunshine duration on a clear day or the actual monthly sunshine duration according to DIN standard by displaying the frequency of clouds in the course of the day as a colour chart or shadow diagram. The percentage of buildings which do not meet the specified minimum requirements for the insolation duration is also determined.
All results are displayed in the form of tables and colour charts. For a better surveillance of the optimisation success, the original version can be compared with the optimised alternative and displayed as a colour chart for the desired category.
As a result of these calculations, Figure 3/17 shows the solar losses caused by the shadows of trees. Figure 3/18 shows the solar losses caused by an unfavourable orientation of the buildings for the same group of adjoining houses.
The Ministry of Economics Baden-Württemberg issued SOLAR BOOKLET
(siehe (see Figure 3-18a)) shows examples of the possibilities of a more energy-conscious planning.
Study of Shading on Models
If a physical model of planned buildings or developments is constructed for wind tunnel studies (see Chapter 4.2) or other purposes, this raises the possibility of a shading study by means of illuminating the model. A strong light source functions as the sun, for which the geometric relationships relative to the chosen day and hour must correspond to the actual position of the sun. The resultant shading pictures are then documented photographically and evaluated.
|
|
| | | |
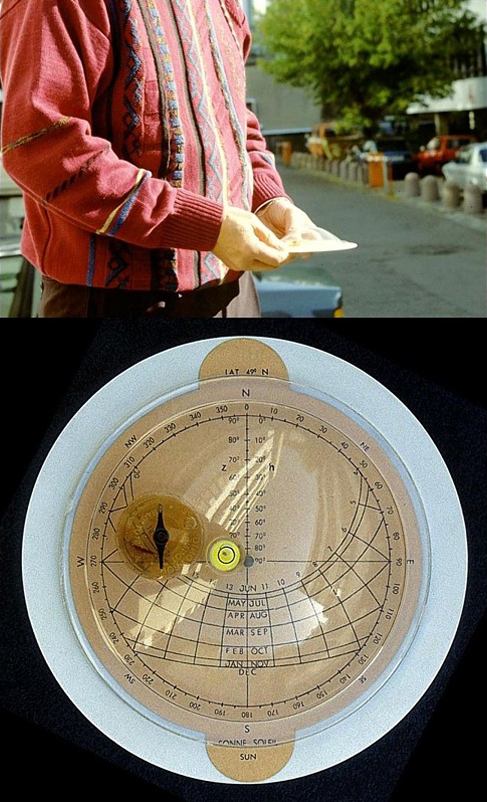 |
| Fig. 3/14: The Horizontoskop of TONNE in use | | |
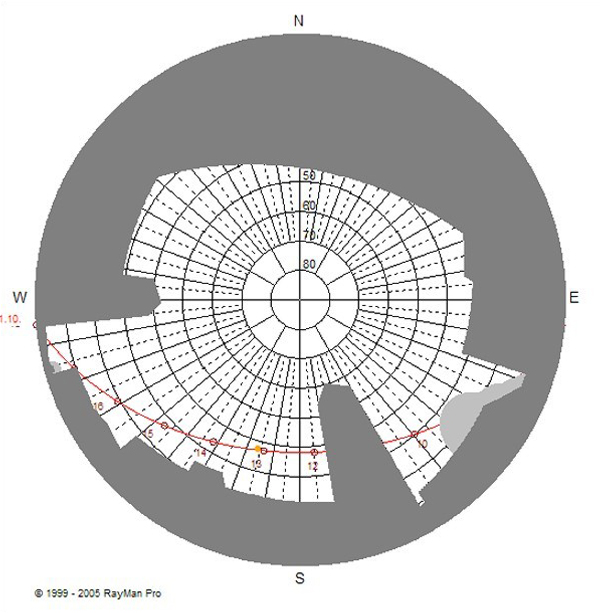 |
| Fig. 3/15: Horizontogramm calculated withRayMan | | |
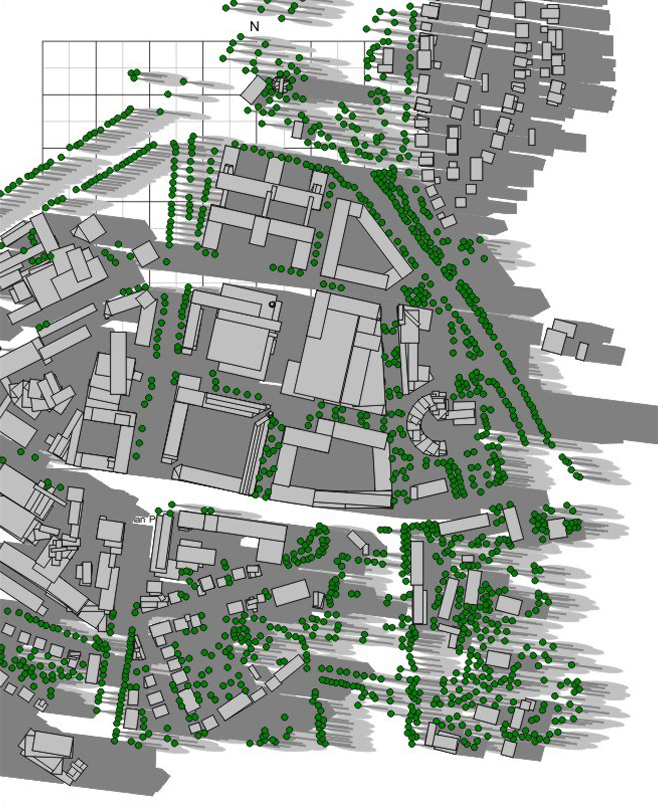 |
Fig. 3/16: Display of shadows with RayMan
Source: Matzerakis and Rutz, 2007 | | |
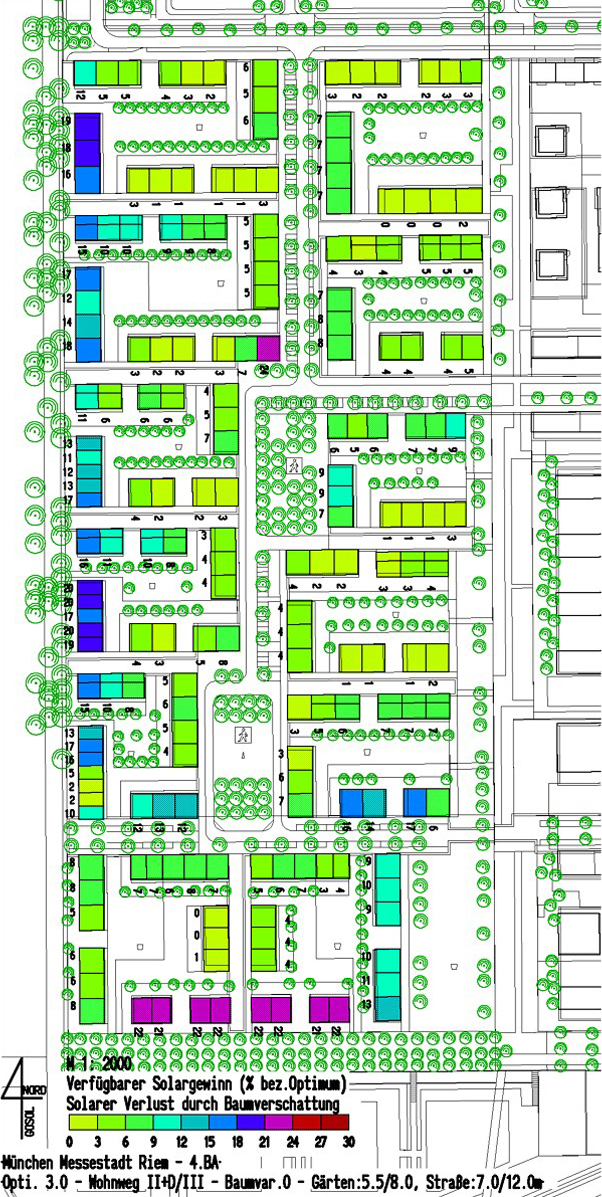 |
| Fig. 3/17: Representation of the solar loss by tree shading (GORETZKI, 2012) | | |
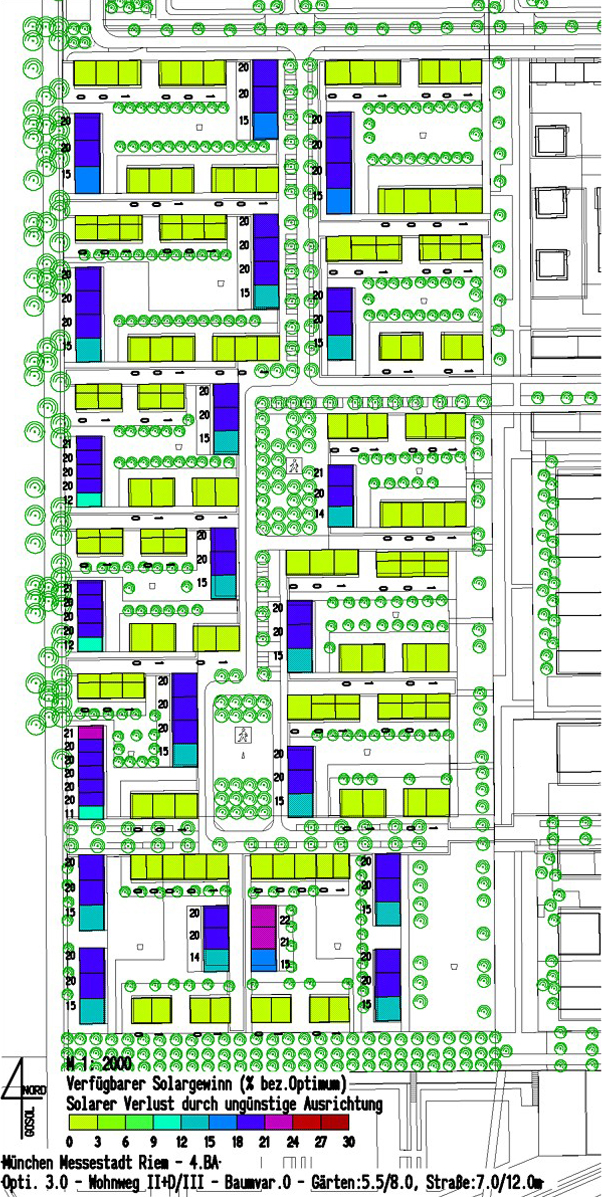 |
Fig. 3/18: Representation of the solar loss due to unfavorable orientation of buildings
(GORETZKI, 2012) | | |
 |
| Fig. 3/18a: SOLARFIBEL - Urban measures, energetic effect relationships and requirements, Source: Ministry of Economics Baden-Wuerttemberg, 2007 |
|