|
|
| ENERGY-CONSCIOUS PLANNING AND ZONING |  |
| | | |
 3.2.2 Solar geometry 3.2.2 Solar geometry |
Global radiation has its maximum in the direction of the respective position of the sun. Solar energy use in its simplest form is thus based on the optimal exposure of those surfaces foreseen or oriented for use in energy conversion, as well as their freedom from shadow.
Foundations and essential aids for the calculation of radiation include databases and the VDI 3789 Bl DIRECTIVE 2 (1994) and SOLAR WORTH , MINISTRY OF ECONOMY BADEN WÜRTTEMBERG (2007).
Exposure
The orientation of surfaces according to direction and angle of inclination leads to various amounts of absorbed radiation. Daily and yearly variations in the position of the sun must also be taken into account. (In fact, the noontime solar zenith varies by 47 degrees between the summer and winter solstices.) Maximum solar radiation thus shifts to more southerly oriented surfaces during winter because of the lower position of the sun.
A simple aid for the assessment of surface orientation in regards to usage of the annual solar radiation is depicted in Figure 3/7 from BIASIN and DIETRICH (1992).
This diagram assumes an average annual radiation of 982 kWh/m˛ on a horizontal surface. In the case of a southerly-oriented surface angled at 30°, a maximum annual radiation of 1,055 kWh/m˛ is possible.
In relation to this 100% theoretical maximum value, all other orientations in direction and angles of incline yield lower potential radiation values. When one considers the case of a building wall (angle of inclination 90°), one can ascertain a comparatively small change for orientations in the semi-circle from east through south to west in relation to the decreasing solar elevations in the east and west. That is, the annual solar radiation remains in the area of 60% to 68% of the maximum value. Admittedly, this denotes a much smaller amount of radiation than in the case of a horizontal surface, which is shown at 93% in the radiation diagram. Only the exposure area contained by the 93% curve signifies a radiation efficiency exceeding that of a horizontal surface.
To evaluate passive solar energy through windows , it is necessary to consider the details of walls of different orientations differentiated: In Figure 3/8 involving also north wall orientations annual cycles of monthly mean radiation are (divided into diffuse radiation and direct radiation) exemplified for Stuttgart.
The following are this obvious:
Greater global radiation on nearly cloudless days implies lesser proportions of diffuse celestial radiation. However, the diffuse radiation is distributed in completely overcast nearly evenly in all directions with an intensity maximum at the zenith. On average (that is, under consideration of average cloud conditions), however, the comparable values for the proportion of diffuse radiation are 50% (south wall) and 95% (north wall).
The proportion of diffuse radiation under average conditions produces a certain equalization in global radiation at various orientations. The global radiation for east and west walls amounts on average to 81% of that of the respective south wall. The comparison value for the ratio north wall to south wall is around 48%.
The energy-related advantage of a southerly orientation comes into play during the heating season. Above all during the months of November, December, and January, southward-facing surfaces show considerable deficits in radiation. In relation to the heating season, northern walls prove significantly less efficient in comparison to the year-round average.
A further point pertains to the southerly orientation of building walls as well as large window surfaces: The environment of the city with its close proximity of structures produces an artificial heightening of the horizon at low positions of the sun (mornings and evenings, especially in winter months), which results in later sunrises and earlier sunsets. Thus there exists a greater chance of freedom from shading for the southern sky, which provides additional importance to southward-facing surfaces. An orientation of building windows exclusively towards the south reduces energy use by about 10%.
Figure 3/9 shows the influence of the main facade"s orientation on the annual heat requirements for different energy standards. The calculations were made for a building with a surface-to-volume ratio of 0.93 and a percentage of the window area of 16 %. Buildings meeting the 2009 Energy Saving Ordinance requirements have only slightly increased heating requirements when they are not oriented to the south. Buildings with an energy standard increased by 30 %, however, depend much stronger on the orientation as the percentage of solar energy in their heat balance is higher.
Shading
Shading signifies a reduction in the astronomically possible sunlight through heightening of the horizon, e.g. from mountains or surrounding buildings. Primarily in the case of valleys and northerly-exposed surfaces, but also in areas of dense urban development, restrictions arise in the duration of sunshine.
Due to shading at low positions of the sun, northerly slopes with inclines up to 10° receive 10% to 30% less global radiation in winter than southerly-oriented faces. Development on northerly slopes should thus be avoided as much as possible, since these microclimatic disadvantages can only be insufficiently compensated through other built measures (DUETZ and MAERTIN, 1982).
Helpful for the planning are calculated solar maps which illustrate these relations. Figure 3/10 shows the direct sun radiation as a annual mean for the area of Stuttgart. The great differences in radiation in dependence of the different slopes can be seen clearly. In Figure 3/10a the global radiation is illustrated.
In Figure 3/11 the result of a computer calculation of the solar radiation for a planned construction area is reproduced (GORETZKI, 2012). Although we here at first glance because of the favorable exposure ideal conditions would have expected for the passive use of solar energy , the simulation shows the heating season due to slope shading (due to terrain) partially reduced by up to 50 % radiation.
With the help of the polar coordinate diagram in Figure 3/12, the astronomically possible duration of sunshine for a location and its limitations due to horizon heightening and shading can be calculated from the various sun curves for particular times of the year. The diagram is strictly valid for the coordinates 49° 46" N, 9° 11" E, and thus in this form can be used with sufficient accuracy in the state of Baden-Württemberg. At this geographic latitude, the extreme values of the sun"s position at 12:00 local time (not Central European Time!) are:
64,5° (June 21, Summer Solstice)
17,6° (December 21, Winter Solstice)
The position of the sun for other dates and times can also be read from Figure 3/12.
Solar tracks for other locations and arbitrary dates can be requested at the internet address:
http://www.stadtklima-stuttgart.de/index.php?climate_sun_position
The dashed lines give the time in Central European Time. The concentric circles are supplied with a scale in degrees for the elevation of the sun. The respective position of the sun is calculated from the intersection of a crosswise date curve with an upright time curve. At the intersection, one can read the angle of the solar elevation (concentric circles) as well as the solar azimuth (direction towards the sun in the sky), the latter of which comes from connecting the intersection with the middle point of the diagram and reading the resultant direction from the compass.
If one inserts into such a diagram a picture of the local topography or built environment from the perspective of a location to be examined, the portion of the solar track not obscured by heightening of the horizon shows the remaining potential for sunlight. Thereby the shading produced by existing or planned buildings in the southern part of the hemisphere can be assessed. This method is described in detail in TONNE (1954) (compare with Chapter 3.2.3).
The picture must be inserted into the diagram in a polar projection, similar to the reflected image on a mirrored half-sphere at the level of the horizon. The middle point of the diagram corresponds to the zenith, from which all vertical building lines emanate. The outer circle of the diagram corresponds to the horizon. Spatial lines running parallel to the horizon and horizontal building lines are transposed to concentric circles relative to their height.
It must be kept in mind that the roof edge of a long, straight building appears to the viewer at large side angles to have a smaller angle of height, so that the building picture cuts the concentric circles in accordance with the variation of the elevation angle.
In the open area the use of an fisheye camera is recommendable. With the knowledge of the point of the compass it is possible to overlay the taken pictures with the solar tracks of the polar diagramm. Figure 3/13 shows the result for the center of the market place in Stuttgart.
DIN 5034-1 can be consulted for a better evaluation of insolation conditions. It contains different criteria for the minimum requirements for the astronomically possible sunshine duration. According to the current version from July 2011, the possible insolation duration at an equinox in at least one habitable room should be four hours. If sufficient insolation is also desired during the winter months, the possible sunshine duration on 17 January should be at least one hour. The place to measure insolation is the middle of a window at the facade"s surface. Insolation is given when the sun is over the visible horizon plus at least six degrees over the true horizon. Steep landscape elevations or high trees count as obstructions. In the previous version of DIN 5034-1 from October 1999, the one-hour insolation duration on 17 January was the sole criterion. The definition of a sufficiently insolated accommodation was that at least one habitable room is sufficiently insolated.
In the interest of healthy living, Grandjean and Gilgen (1973) require an insolation duration of at least three hours on an average winter day (8 February) and an angle of light incidence of at least 15 degrees to the window surface.
If these minimal requirements for the amount of sunlight cannot be fulfilled through correspondingly chosen distances between buildings, or where this is not desirable from an urban design perspective because of the gaps between buildings that would result, sun exposure for southern facades (realigning the longitudinal axes of buildings predominantly to an east-west direction) should be ensured by means of reduced building heights. Higher structural forms should thus be planned on the northern sides of buildings.
Studies of sunlight conditions frequently result from the need to plan and build effective solar protection to avoid overheating during summer. This takes place at best in the form of roof projections or balconies, which with the right dimensions provide shielding from solar radiation in summer without hindering the desired radiation during the winter heating period. Deciduous trees are equally suited to this task, as these shed their shade-producing leaves (in contrast to coniferous trees).
|
|
| | | |
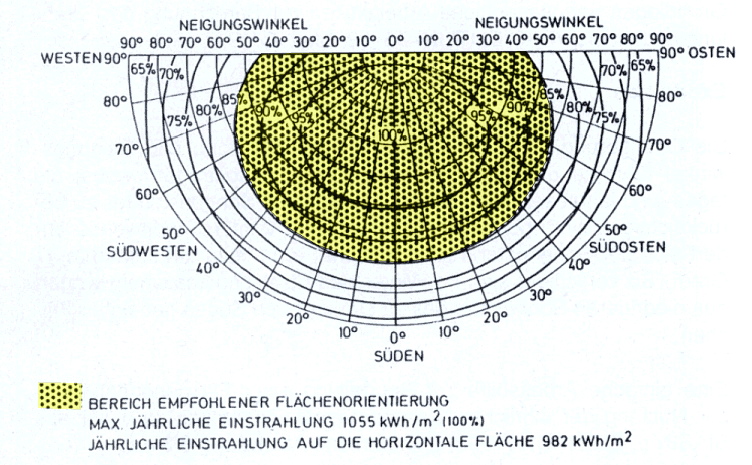 |
| Fig. 3/7: Irradiation diagram (from BIASIN and DIETRICH, 1992) | | |
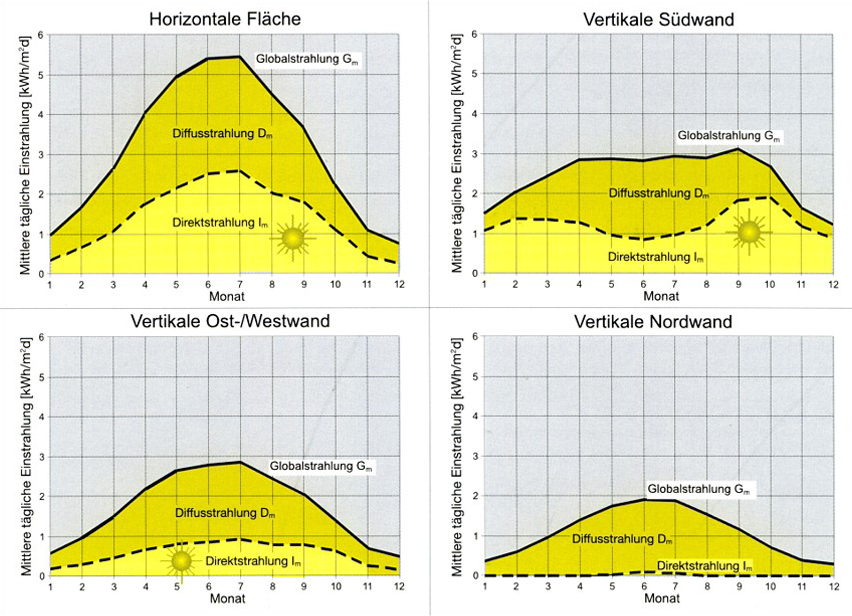 |
| Fig. 3/8: Mean monthly global radiation for Stuttgart on differently oriented surfaces. Source: SOLAR BOOKLET 2007, Ministry of Economics Baden -Wuerttemberg | | |
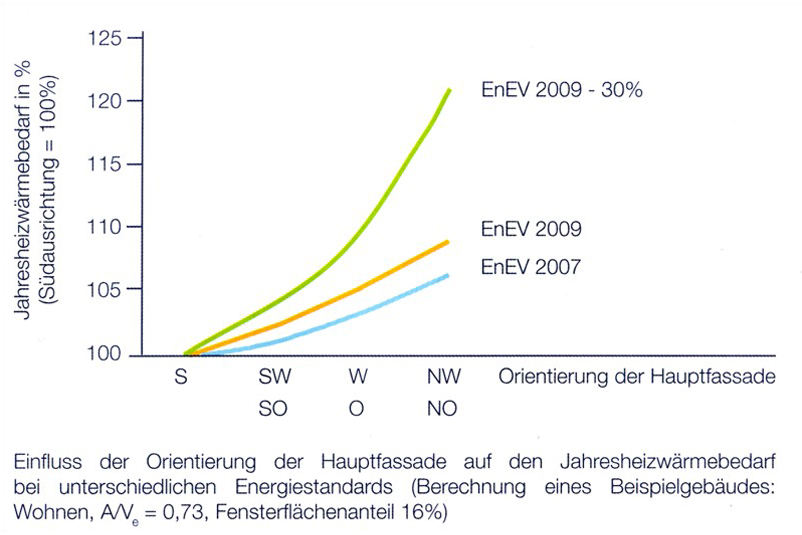 |
| Fig. 3/9: Influence on the heating requirements, Source : Bavarian State Ministry of the Interior , 2010 | | |
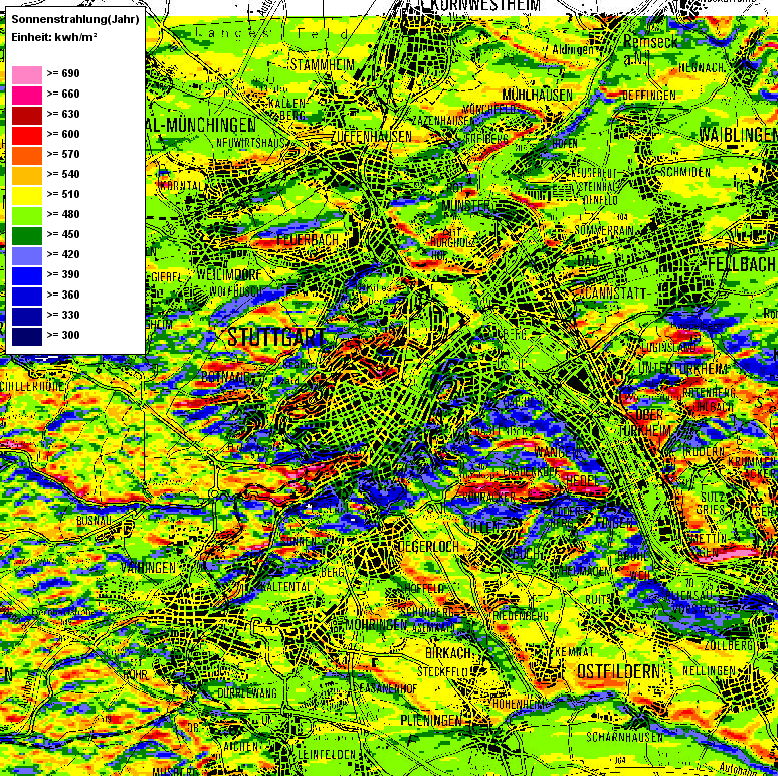 |
Fig. 3/10: Annual average of the direct solar radiation in the city Stuttgart,
Source: Solar Atlas Stuttgart | | |
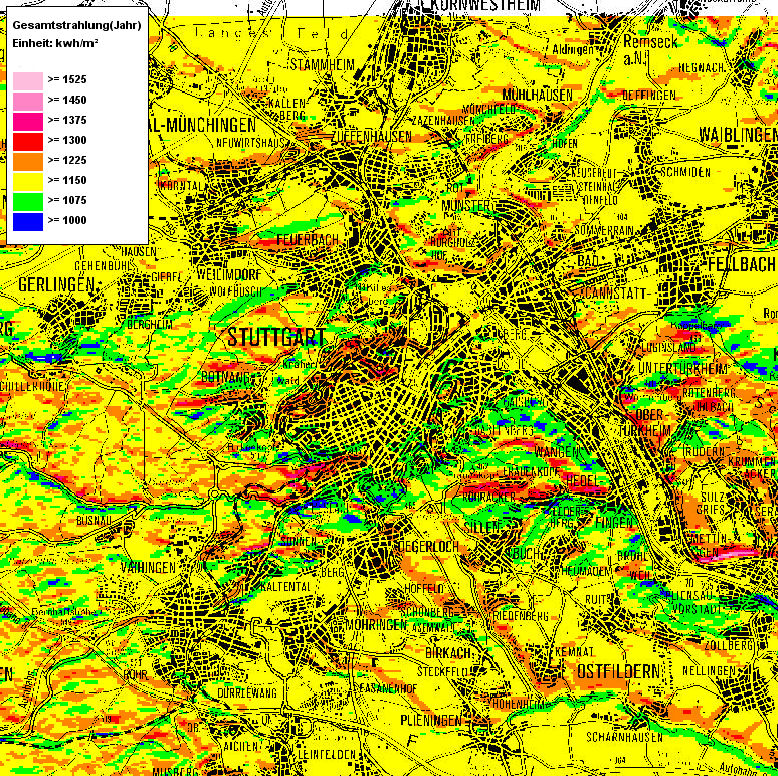 |
Fig. 3/10a: Annual average of the global radiation in the city Stuttgart,
Source: Solar Atlas Stuttgart Solar Atlas Stuttgart
(www.stadtklima-stuttgart.de)
| | |
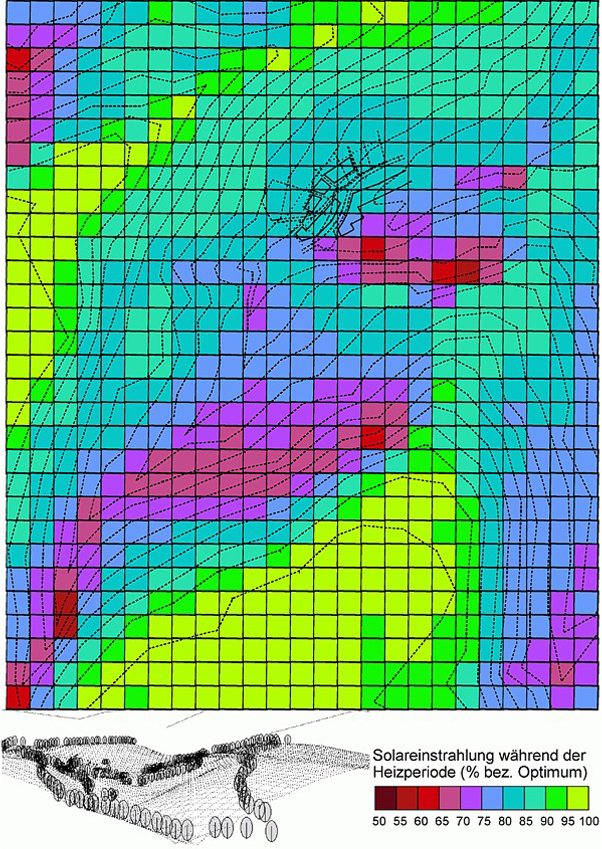 |
| Fig. 3/11: Solar radiation , taking account of shading by the terrain, Source: GORETZKI, 2012 | | |
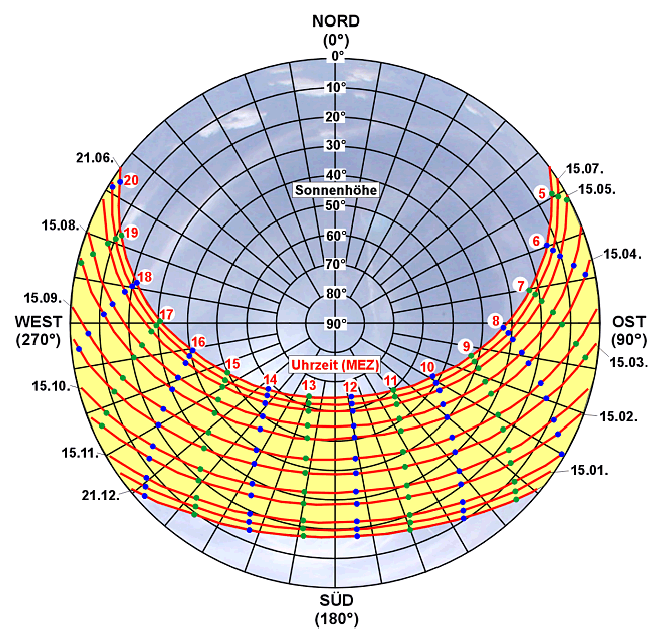 |
| Fig. 3/12: Sun exposure diagram for latitude 48°46" N and longitude 9°11" E | | |
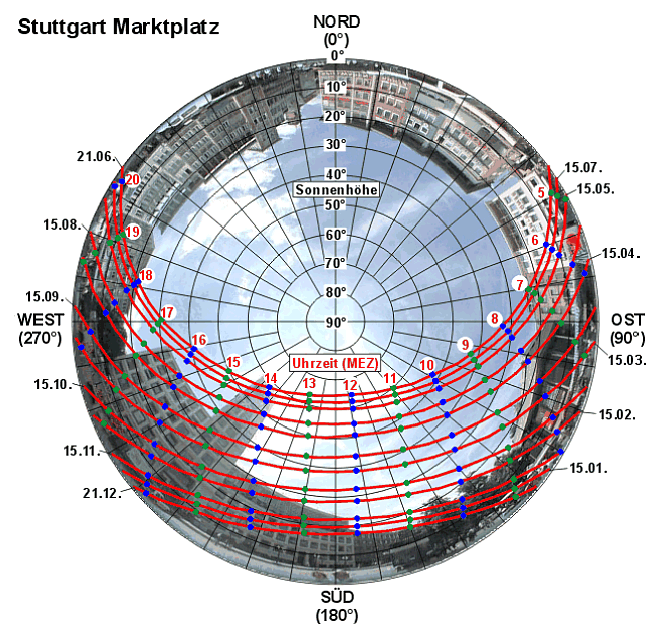 |
Fig. 3/13: Sun exposure diagram for
"Stuttgart Marktplatz" |
|